I built a World Cup model around jet lag, then graded it in public
104 matches, 10,000 simulations, and the one thing it kept getting wrong.
Most World Cup prediction models rank teams by strength and leave it there. That always felt like it was missing something. The 2026 tournament was spread across the US, Canada, and Mexico — four time zones, cities at sea level and cities a mile up, June heat in some places and air conditioning in others, and kickoff times that can drag a European team’s body clock to four in the morning. Some teams got an easy run of it. Others got a schedule that would flatten a touring band.
So I built JetLag XI to measure that, simulate the whole tournament on top of it, and — the part I actually cared about — save every prediction so I could see afterward how wrong it was.
The tournament’s done now. Spain beat Argentina 1–0 in the final. So this is the honest version of the writeup: what the model got right, what it didn’t, and the one thing it was never going to get right given how I built it.
How it works
Two things go into every match prediction.
The first is strength — plain Elo ratings, sanity-checked against squad market values. Elo is just a number per team that goes up when they win and down when they lose, and the gap between two teams turns “who’s better” into “by how much,” which is what you need to get a scoreline out.
The second is fatigue, and this is the part I hadn’t seen anyone actually put on the board. It’s all computable from the fixture list: how far each team flies (the trip in, plus every hop between cities), how many time zones they cross and re-cross, how much the altitude jumps around, the heat, the rest days between games, and a little circadian penalty for how far each kickoff sits from a comfortable mid-afternoon on the team’s home clock. A 9pm local kickoff is a different game if your body still thinks it’s in Buenos Aires. I rolled all of that into one “Edge Index,” with a bonus for the host nations who got to sleep in their own beds.
Then it all runs through a Monte Carlo simulation — 10,000 full tournaments every time it refreshes. Each group match draws goals from the Elo gap, the real tiebreakers sort the tables, and the bracket plays out through the knockouts. I went with simulation instead of just using Elo directly because Elo can only tell you the odds of one team beating another. It can’t tell you a team’s chance of winning the group or reaching the final through a 48-team bracket with third-place qualifiers — for that you have to actually play the thing out, thousands of times, and count. That’s the only way “odds of winning the whole tournament” falls out the other end.
The whole pipeline refreshes itself hourly during the tournament off a GitHub Action that pulls the latest scores, rebuilds, and re-runs the sim. I mostly just watched.
The scorecard
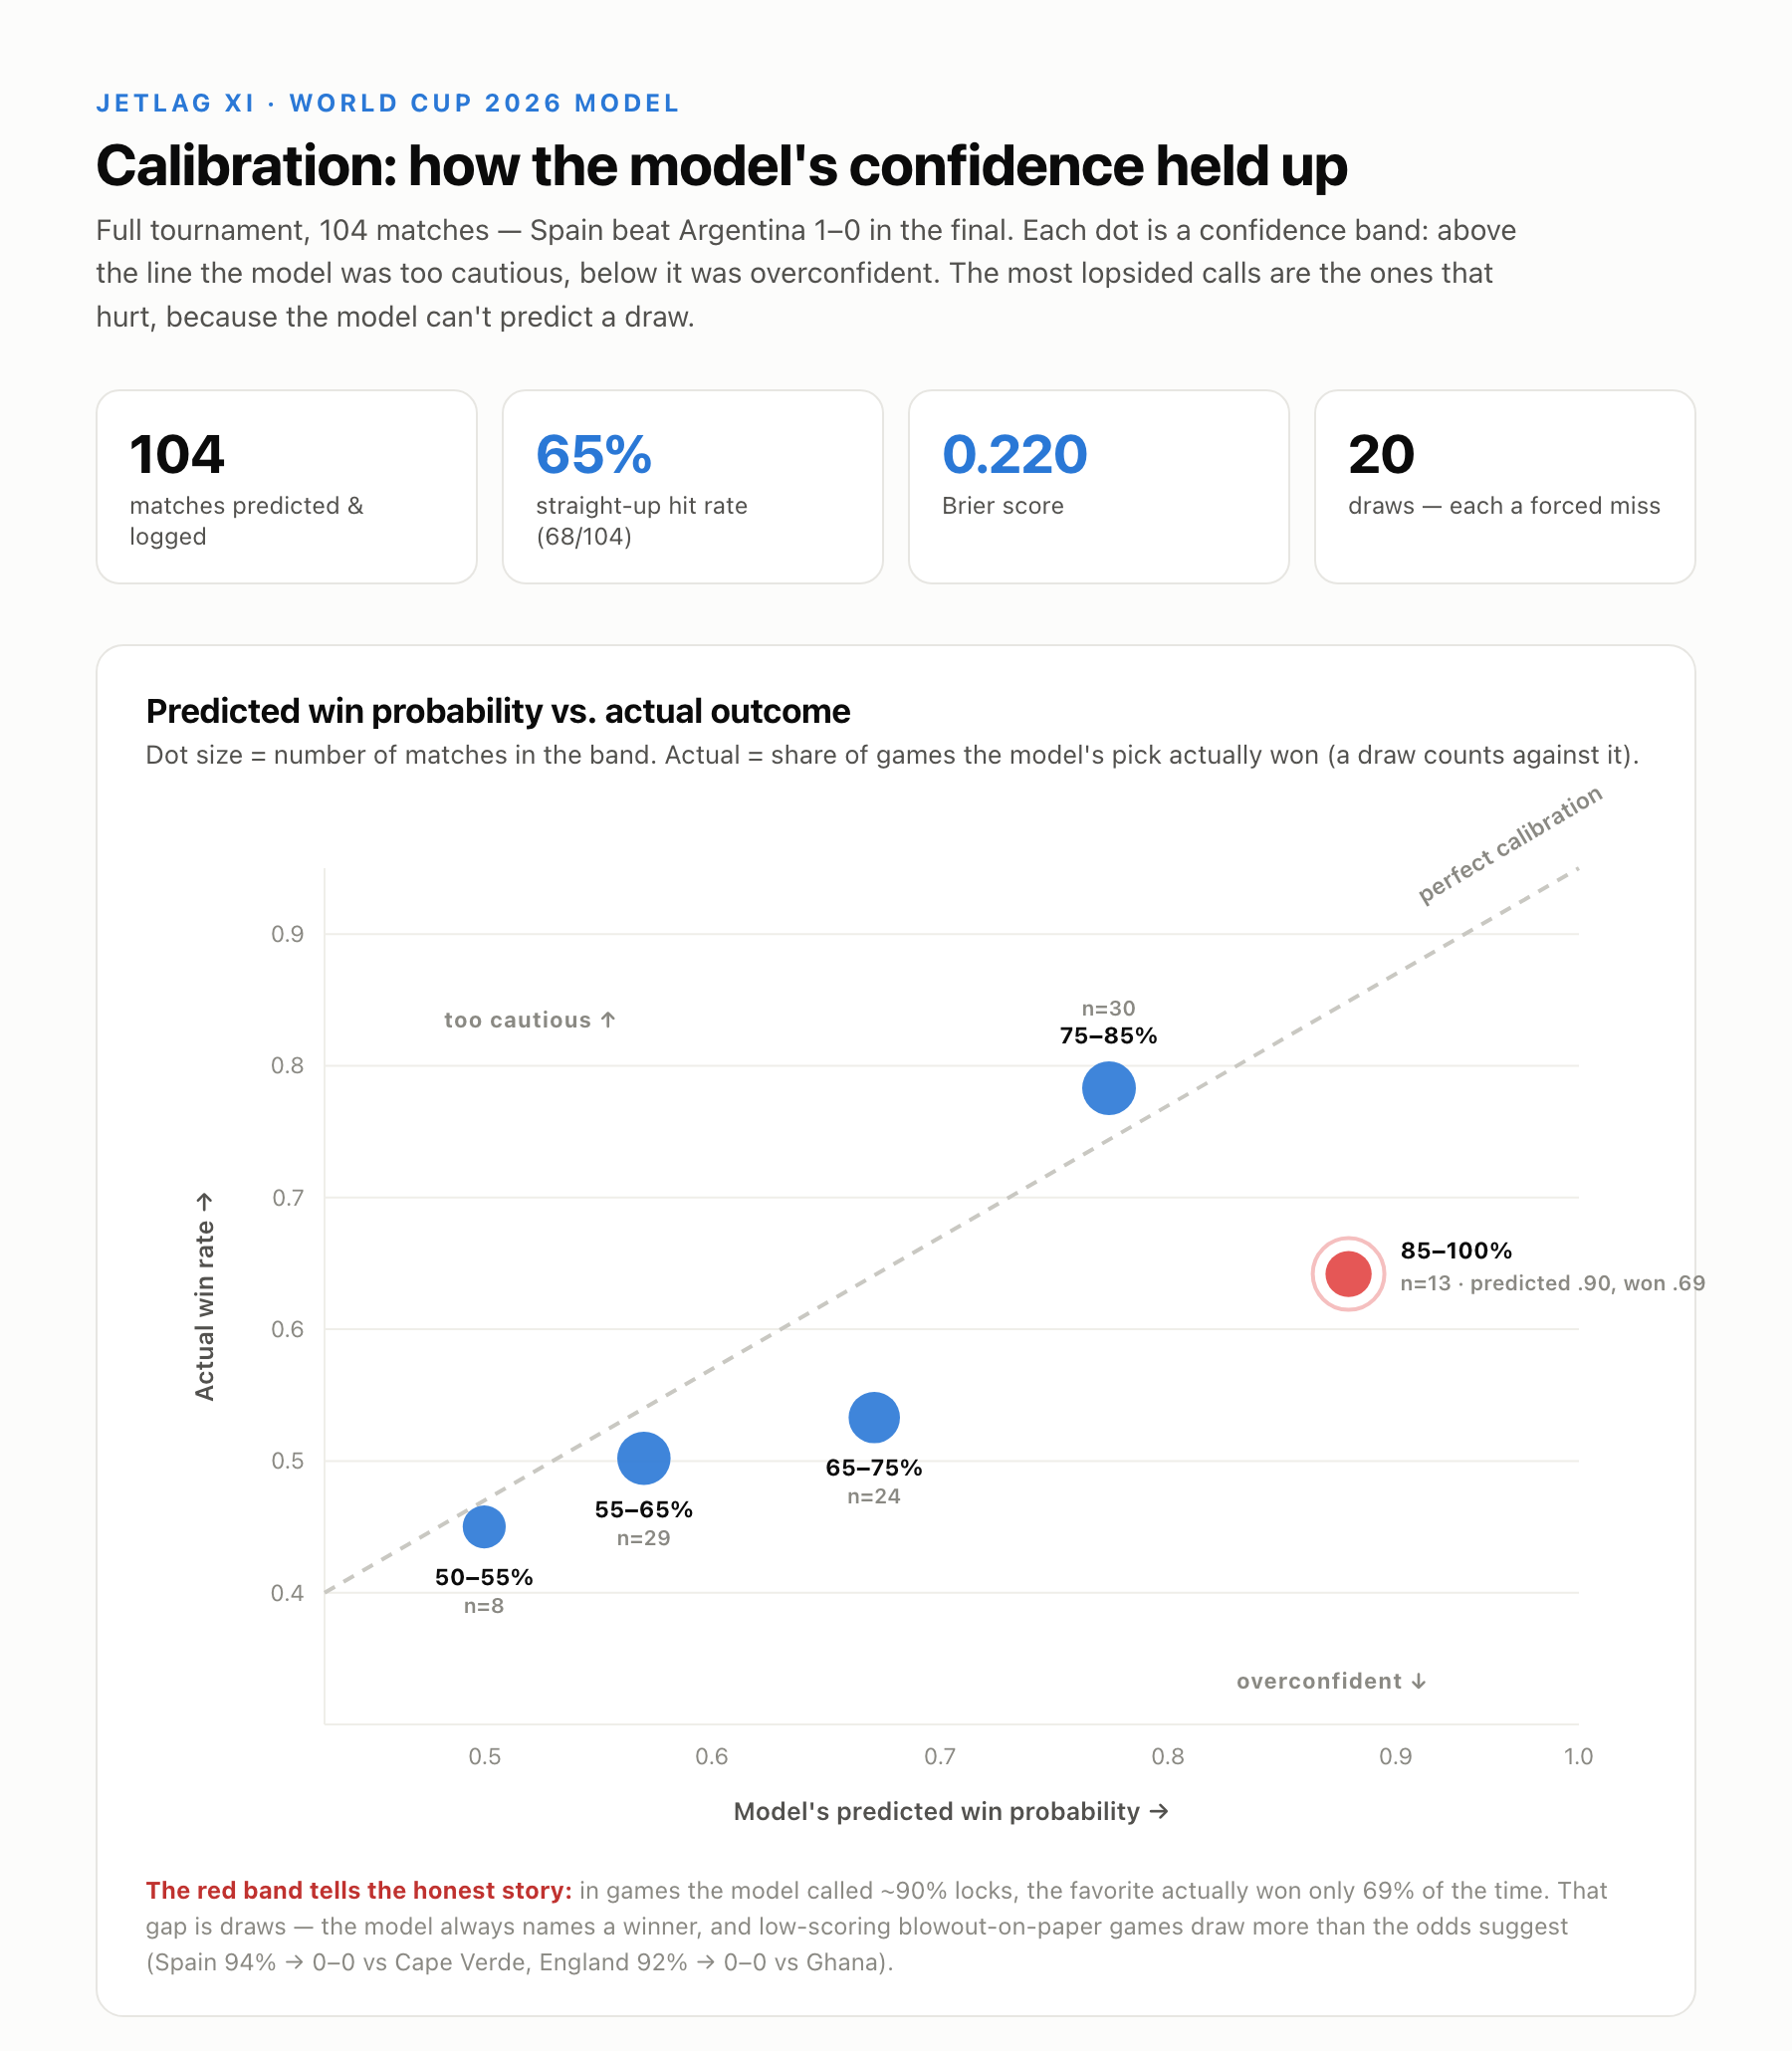
Over 104 matches it went 65% straight up, with a Brier score of 0.220. Every prediction got written down next to the real result the moment the game finished, so none of this is me remembering the good calls and forgetting the bad ones.
The chart is the bit I’d actually stand behind. Each dot is a confidence band — above the line the model was too cautious, below it too sure of itself. Four of the five bands sit close enough to the line. It’s the red one that’s interesting, and it points straight at the thing I got wrong.
What it got right
The travel idea paid off where you’d most expect it to: the hosts. The US, Mexico, and Canada flew basically nowhere and slept at home the whole time — exactly what the Edge Index rewards — and all three did better than their raw ratings said they should. The US was an underdog on paper against Paraguay and won 4–1. A strength-only model calls that game the other way; the one that knew about the travel didn’t. That single result is the whole premise working.
The favorites also held up top. The four teams the sim liked most — France, Spain, Argentina, England — all made the semis, the final was Spain against Argentina, and its pick won. It had the final itself as pretty much a coin flip (52% Spain), which, for a 1–0, feels about right.
What it got wrong
Here’s the one I’d tell you about before you had to find it yourself: the model can’t predict a draw.
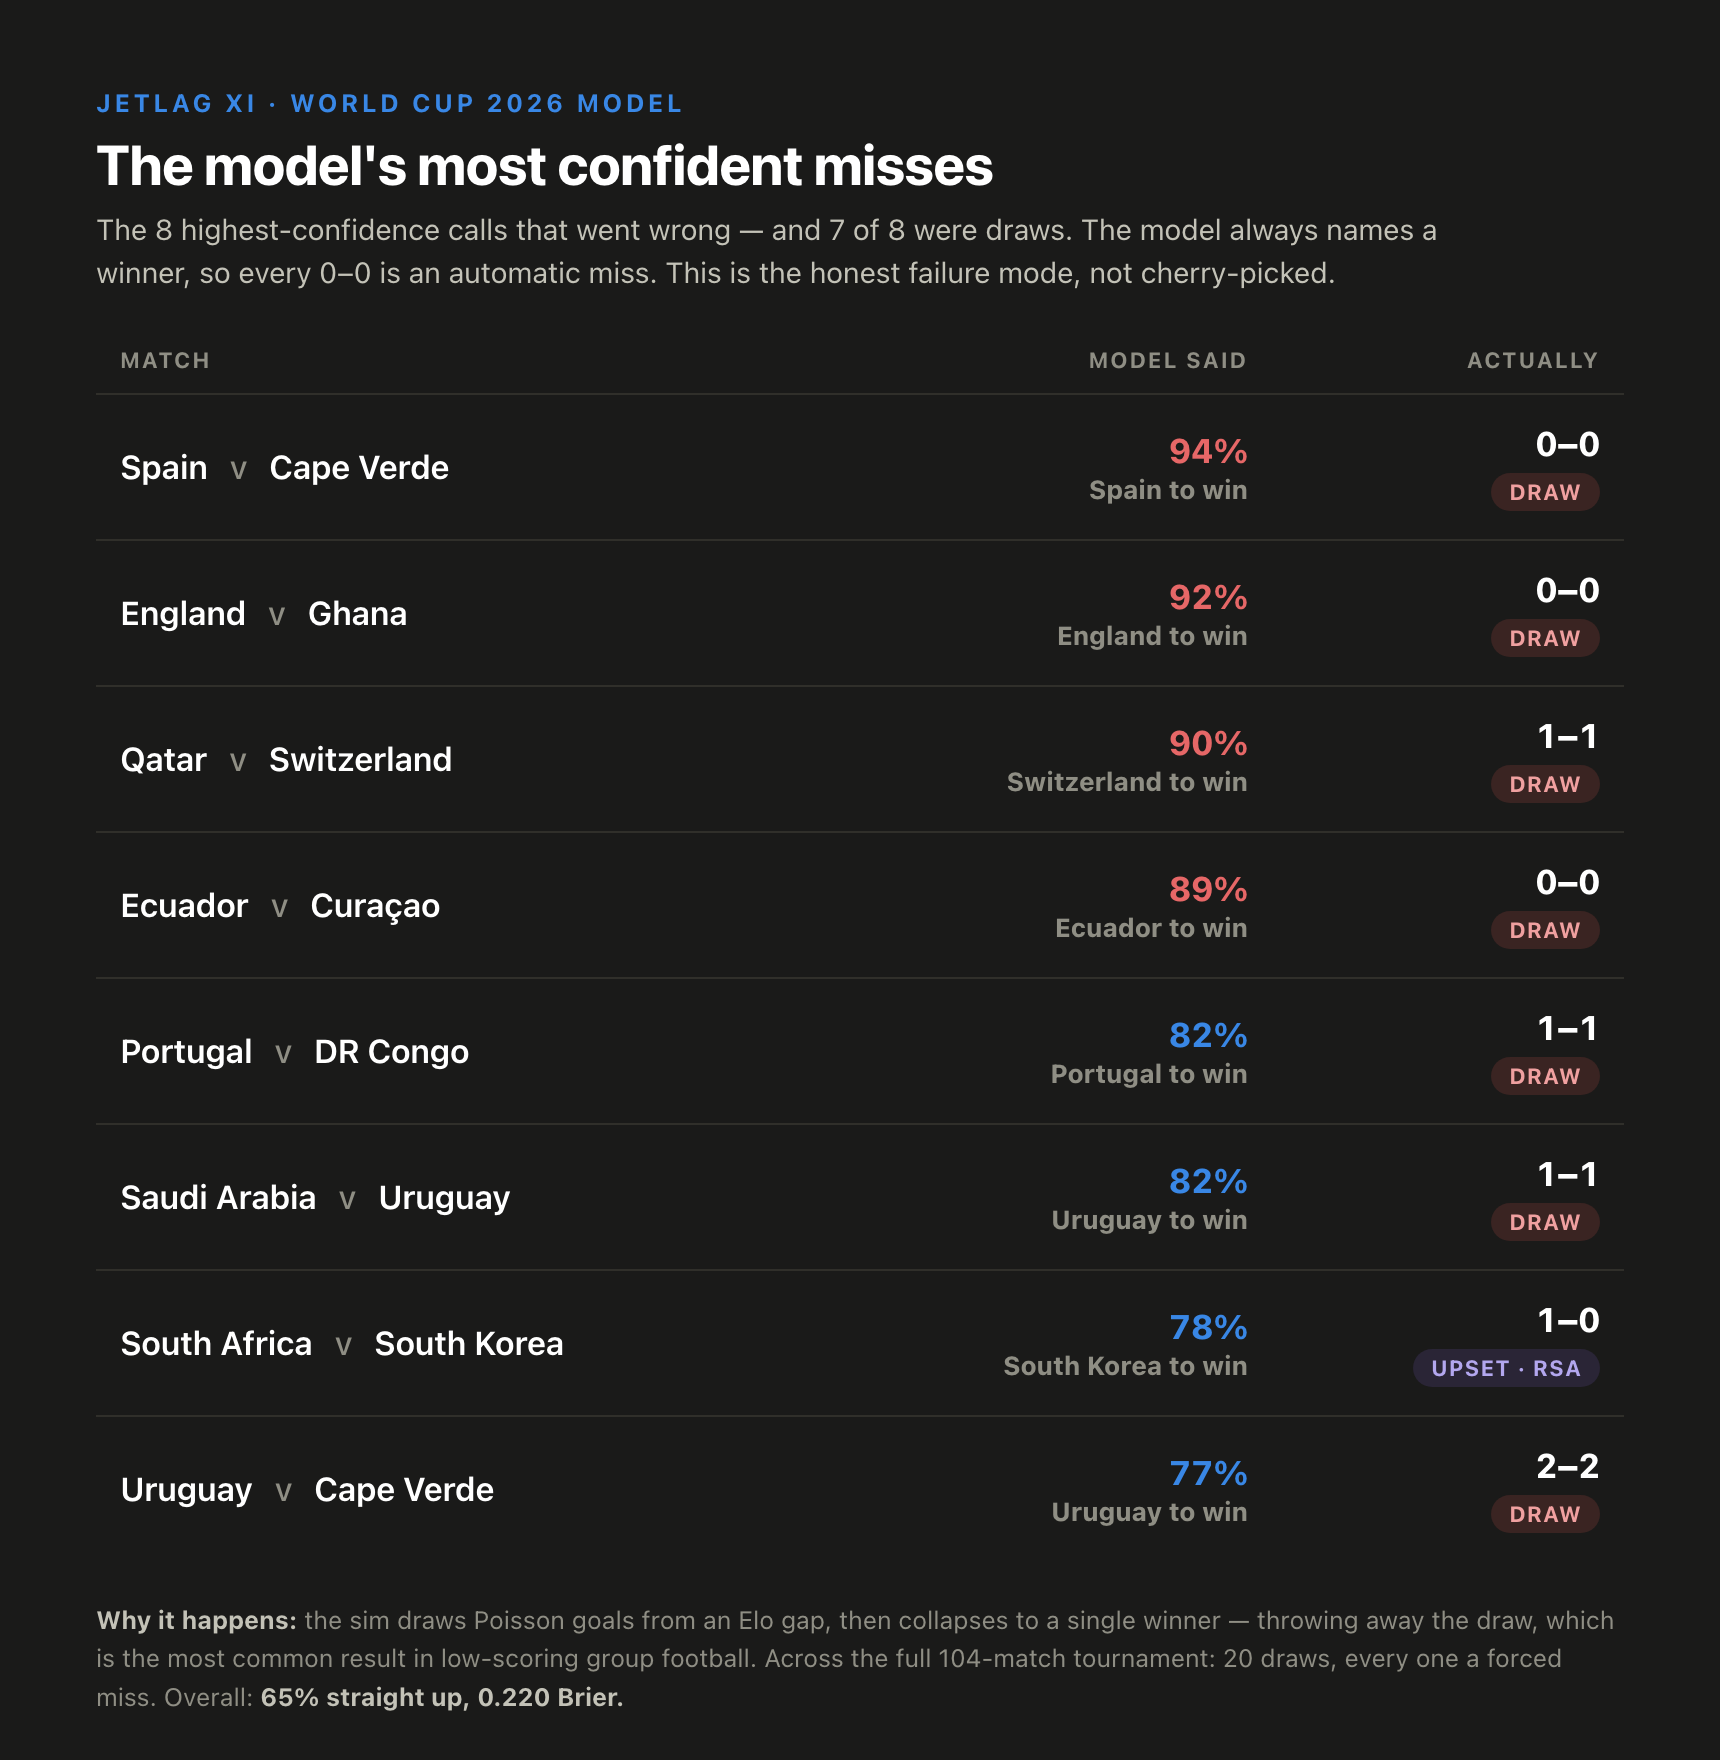
It only ever outputs a winner, so a 0–0 is a miss no matter what. And its most confident calls were the worst offenders — Spain at 94% over Cape Verde, 0–0; England 92% over Ghana, 0–0. Seven of its eight biggest misses were draws.
That’s the red band from the earlier chart. In games it called roughly 90% locks, the favorite actually won only about two-thirds of the time, and that whole gap is draws. It’s baked into how I built it: the sim turns an Elo gap into goals and then just picks whoever scored more, tossing the draw out. But a draw is the most common result in a tight group game — especially a strong side against one happy to sit ten men behind the ball, which is exactly the matchup the model was most confident about. Twenty draws across the tournament, every one an automatic miss. A proper win/draw/loss output is the first thing I’d change.
Why grade it at all
Anyone can say their model was 65% accurate. It’s hard to believe because you never get to see the misses. I didn’t want a model that’s always right — there’s no such thing for football — I wanted one that’s upfront about where it’s wrong. Every prediction logged, every miss visible, the blind spot spelled out. The calibration page is really just that promise made concrete: it doesn’t get to quietly forget the games it blew.